
Leveraging Smart Home Data for Predictive Maintenance
Predictive Maintenance for Smart Homes: Reading the Signals Before Things Break
It's 2 AM in February, the bedroom is 14 °C, and the heat pump that worked fine yesterday is throwing an error code you've never seen. The technician arrives the next afternoon, charges weekend rates, and tells you the compressor has been struggling for weeks. You had no way of knowing — except that you did. The data was there. You just weren't looking at it. Predictive maintenance smart homes systems exist precisely to close this gap: not by adding more devices, but by reading the signals the devices you already own are quietly producing.
Most failures in a connected home aren't sudden. They're the visible end of a slow degradation curve that started weeks earlier. A compressor doesn't fail in a single moment — its runtime drifts up, its cycling pattern changes, its current draw climbs. A water heater doesn't quit overnight — its recovery time stretches, its standby load creeps. The hardware is broadcasting its own decline in real time. The only question is whether anyone is listening.
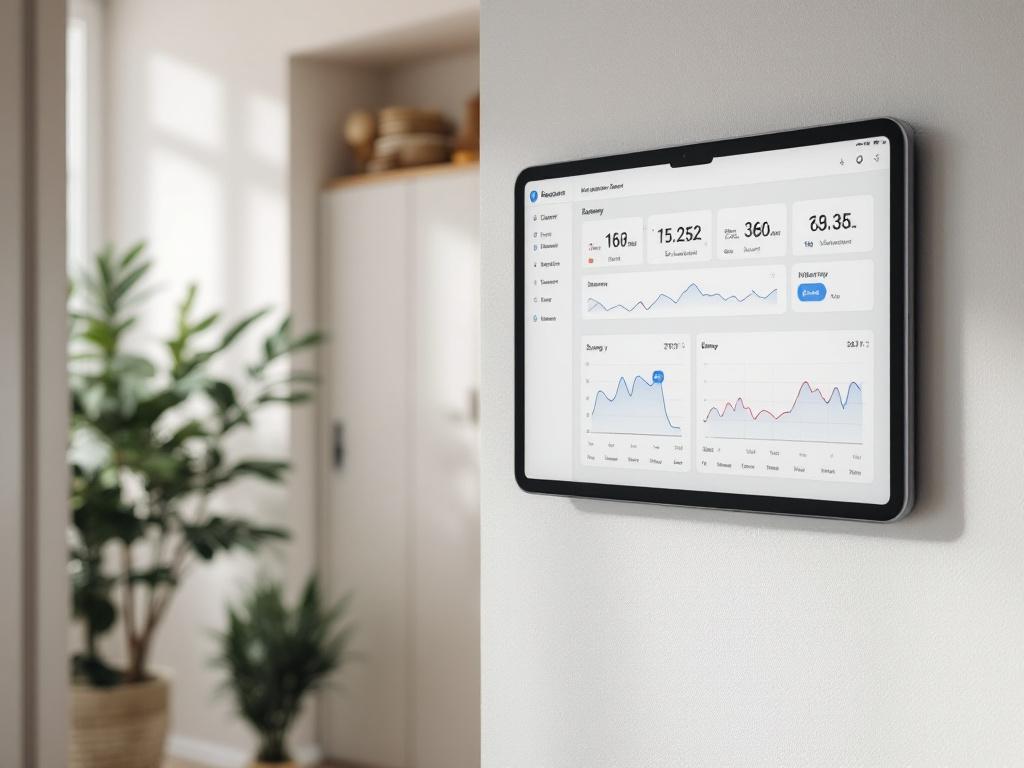
Table of Contents
- The Quiet Signals Your Smart Home Sends Before Something Fails
- Local vs. Cloud Smart Home Architecture for Maintenance Visibility
- Five Device Categories and What Their Data Tells You
- Building a Predictive Maintenance Workflow in Home Assistant
- Five Mistakes That Wreck Predictive Maintenance — And How to Sidestep Them
- Realistic Scenarios — What Predictive Data Catches Before It Costs You
- Your First 90 Days — A Predictive Maintenance Action Plan
The Quiet Signals Your Smart Home Sends Before Something Fails
The cold-night failure described above is rarely a hardware problem in the strict sense. It's a visibility problem. The compressor was already drifting. Nobody had a graph open. That's the gap predictive maintenance closes — and it closes it with data you almost certainly already have, sitting unread in whatever app or hub your devices report to.
There are four signal categories worth knowing by name, because nearly every household failure pattern reduces to one of them.
Runtime drift is the simplest. Your heating cycle that used to take roughly 12 minutes to lift the bedroom 1 °C now takes 16 minutes, with no change in outdoor temperature. That's a 25–30% drift, and it's not noise. It's the system working harder for the same output. Refrigerant loss, coil fouling, blower motor decline — all of these announce themselves first as runtime drift, weeks before the system trips an error code.
Cycling frequency change is the second. Compressors, fans, and pumps that begin short-cycling — turning on and off in rapid succession — are typically under stress. According to HVAC service provider Dixie Land Energy, altered cycling patterns are among the earliest indicators that a component is approaching failure. (Worth noting that this is a vendor's perspective from a company that performs HVAC service, but the underlying mechanical logic — that cycling stress accelerates wear — is uncontroversial across the trade.)
Sensor lag and dropout is the third. Zigbee and Z-Wave sensors that take longer to report state changes, or that vanish from the mesh entirely, are usually telling you something specific: failing batteries, growing RF interference, or a router-class device that's no longer routing well. A motion sensor that used to fire within 1 second but now lags 3–5 seconds is rarely a sensor problem in isolation — it's typically a network problem upstream.
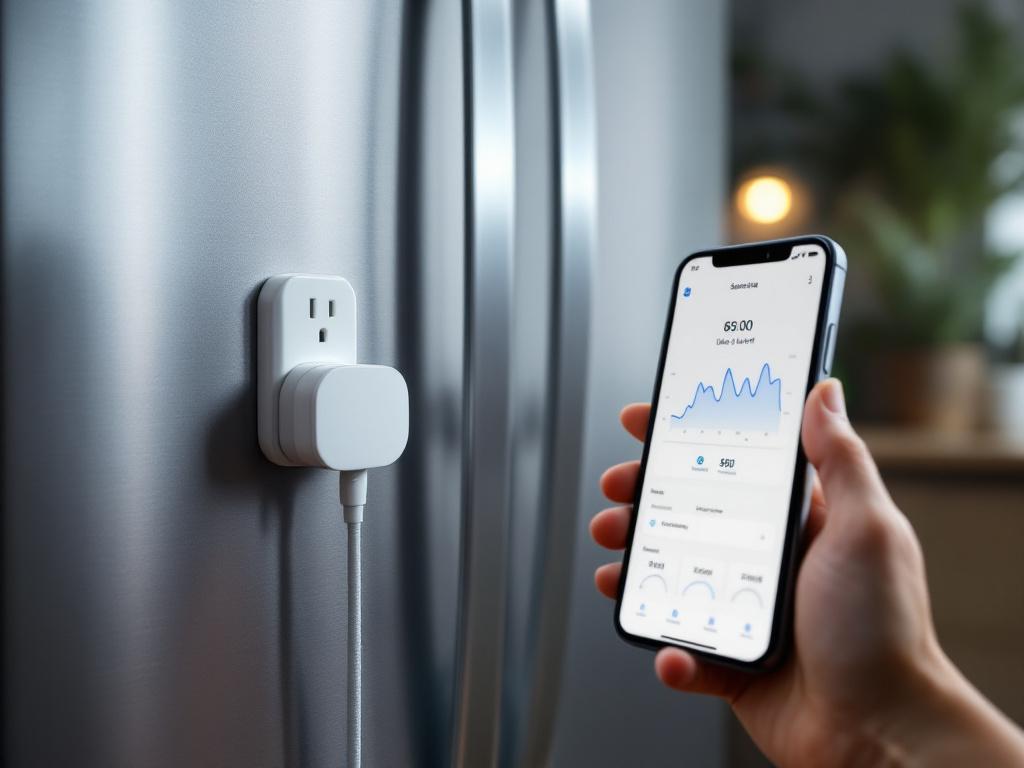
Power consumption signature shift is the fourth and arguably the most useful. A smart plug measuring a refrigerator that has drawn a steady ~80W average for a year, then drifts to ~110W over a month, is showing early compressor inefficiency. The fridge still works. It will keep working for some time. But it's burning more energy for the same cooling, and that gap will widen.
Why are these signals normally invisible? Because most homeowners never look at history graphs, and most consumer cloud apps display only current state. Smart home data that exists only as "right now, the temperature is 21 °C" cannot reveal drift. Drift is, by definition, a comparison across time — and the comparison requires you to actually have the time-series.
Local smart home systems hand you the raw signal. Cloud platforms hand you the vendor's interpretation of the signal. Predictive maintenance is impossible without the former.
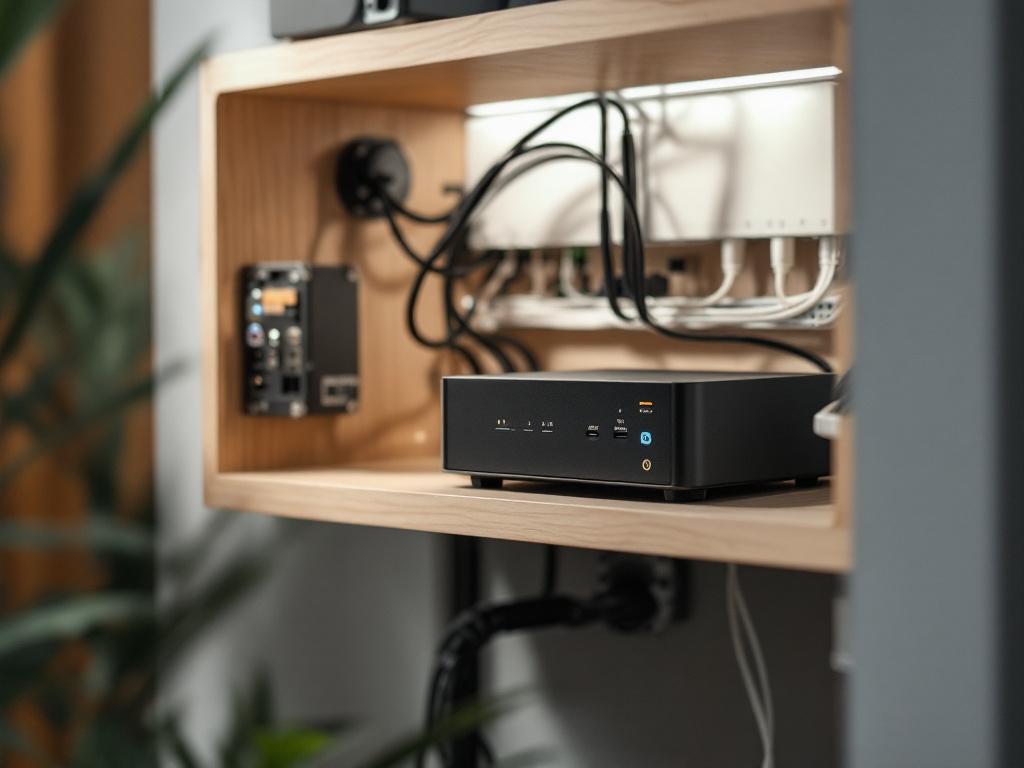
When the data lives on your own server — which has been the default architecture for every Home Assistant installation we've delivered since 2018 — you keep unbroken history at full resolution. No vendor is deciding what's worth showing you. No retention policy is silently truncating last quarter's data. The analytical surface area is yours, which is the precondition for any meaningful IoT analytics workflow.
Recognizing these signals is half the work. The other half is having an architecture that lets you see them.

Local vs. Cloud Smart Home Architecture for Maintenance Visibility
The honest framing here is not "local always wins." It's that the two architectures have different strengths, and for the specific workflow of predicting failures from longitudinal data, those strengths break asymmetrically.
| Capability | Local / On-Premises | Cloud-Dependent (vendor app) |
|---|---|---|
| Sensor history retention | Limited only by your storage | Typically 7–30 days, vendor-defined |
| Data resolution | Full granularity, every state change | Often downsampled or summarized |
| Custom alert thresholds | User-defined, unlimited rules | Preset tiers, sometimes paywalled |
| Operation during internet outage | Continues monitoring and logging | Typically loses telemetry |
| Cross-device correlation | Across any brand on the hub | Limited to vendor's own ecosystem |
| Vendor lock-in risk | None — data is yours | High — data leaves with the service |
| Setup complexity | Higher, or installer-handled | Lower, plug-and-play |
The table isn't a verdict. It's a trade-off map. Cloud platforms are genuinely simpler to set up, and many homeowners use them well for convenience features — voice control, scene activation, away-from-home checks. None of that is wrong.
But for the specific task of predicting a failure from drift, three rows in the table do almost all the work: history retention, data resolution, and offline operation. Spotting drift requires comparing today's behavior against 30, 60, or 90 days ago, at full resolution, with no gaps. A vendor that retains seven days of summary data cannot show you that drift even if it's screaming. The drift exists in the data the vendor already discarded.
Resolution matters for a similar reason. A summary like "the compressor ran 4 hours yesterday" is useless for predictive analysis. You need the underlying state changes — every on, every off, every duty-cycle interval — because the shape of the day is where degradation hides. Two homes with identical four-hour totals can have completely different cycling patterns, and only one of them is in trouble.
Cross-device correlation is the quiet superpower. When all your smart home data sits on one local hub, you can ask questions like: "Show me HVAC runtime against outdoor temperature against indoor occupancy across the last 90 days." That kind of cross-brand, cross-class query is essentially impossible inside a single vendor's app, because the vendor only sees its own devices. Even voice assistants and other interfaces become more useful in a local architecture, because they can act on correlated logic instead of single-device commands.
None of this makes cloud bad. It makes cloud insufficient for predictive maintenance specifically. If that workflow matters to you, history depth and granularity are non-negotiable, and the local model wins on both.
Five Device Categories and What Their Data Tells You
What follows are practitioner heuristics — starting points, not standards. Every home's baseline differs. The numbers below are illustrative ranges to anchor your own observations, not thresholds to apply blindly. Useful smart device maintenance begins when you stop looking for universal numbers and start building familiarity with your own home's normal.
- HVAC and Climate Control. Watch cycling frequency, runtime per degree of delta-T, and the supply/return temperature spread. These predict compressor wear, refrigerant loss, fan motor decline, and clogged filters. Heuristic example: a heating cycle that historically took roughly 12 minutes to lift a room 1 °C now takes about 16 minutes, with no change in outdoor weather — that's roughly 25–30% runtime drift, worth investigating. Local advantage: you can correlate runtime against outdoor temperature from a separate sensor, which rules out weather as the cause and isolates the device itself. This kind of cross-sensor correlation is where IoT analytics earns its keep.
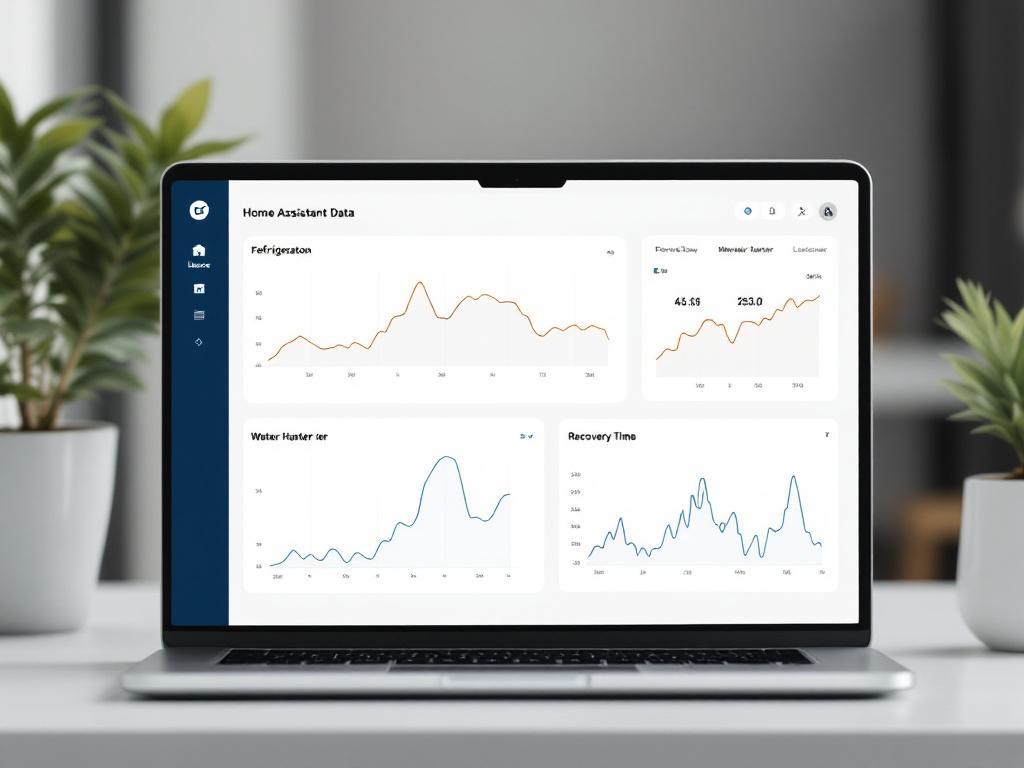
- Water Systems (heaters, pumps, leak sensors). Watch recovery time after hot-water draw, standby power consumption, and micro-leak detection from flow sensors. These predict heating element scaling, anode rod depletion, pump bearing wear, and slab leaks. Heuristic example: standby power draw of an electric water heater creeping roughly 15–20% above its baseline suggests sediment buildup forcing the element to work harder. Catch this early and the fix is a flush; catch it late and the fix is a new heater.
- Electrical and Power Distribution (smart plugs, energy monitors). Watch per-circuit baseline draw, startup inrush patterns, and phantom load drift. These predict failing motor windings in fridges and washers, aging resistive elements, and circuit overloading. Heuristic example: a refrigerator whose typical compressor inrush peak rises from roughly 600W to about 850W over weeks is showing motor degradation. The fridge is still cold. The motor is not.
- Lighting and Occupancy Sensors. Watch actuation latency, dimming consistency, and motion-sensor false-trigger rate. These predict failing drivers, RF mesh weakness, and sensor lens degradation. Heuristic example: a motion sensor that used to report within 1 second but now lags 3–5 seconds usually indicates battery decline well before the low-battery alert fires. This is also where automation that adapts to pets and other occupants starts to misbehave first — degraded sensors corrupt the inputs your automations depend on.
- Security, Door, and Battery-Powered Sensors. Watch battery voltage curves, link quality (LQI), and check-in frequency. These predict imminent battery death, mesh routing problems, and sensor isolation. Heuristic example: a Zigbee contact sensor whose LQI drops from 200+ to under 100 over a month is losing its route — fix the mesh now, not when the front-door sensor reads "open" forever.
These heuristics are starting points. The real work, covered next, is how you build your normal — because that's the only baseline that will actually catch your problems. Predictive maintenance smart homes workflows succeed or fail on the quality of the baseline, not the cleverness of the threshold.
Building a Predictive Maintenance Workflow in Home Assistant
A workflow that survives the first three months looks like this. Five steps, sequential, each with a defined output. Skip steps and you'll either drown in false alarms or miss the real ones.
Step 1 — Establish a Baseline (Weeks 1–4)
Run your devices under normal use without changing settings. Resist the urge to optimize anything yet — you're collecting evidence, not improving the system.
- Configure Home Assistant's
recorderintegration to retain at least 30 days at full resolution. Adjustpurge_keep_daysaccordingly. - Note the seasonal context. A baseline taken in October won't apply in February heating peak. For HVAC and water heaters, plan on at least one baseline per season.
- Output: a simple Markdown note or spreadsheet listing typical ranges per device. This is your reference document. Treat it the way you'd treat planning and visualizing your smart home setup — as a living artifact you'll update.
The whole point of the baseline phase is humility. You don't know your home's normal yet. You think you do. You don't. The data will surprise you, and that's the entire value of doing this.
Step 2 — Define Anomaly Thresholds (Week 4–5)
Once the baseline exists, set thresholds at roughly ±15–20% deviation as a starting heuristic. This is the sweet spot for most household devices: tight enough to catch real drift, loose enough to ignore weather, occupancy, and other legitimate variation.
- Use Home Assistant
statisticssensors to compute rolling averages. A 24-hour mean and a 7-day mean, compared against current values, gives you a fast-and-slow view of the same metric. - Avoid single-metric alerts. Require at least two correlated signals — runtime drift and power-draw drift, for example — before flagging. Single-metric alerts are the reason people mute their notifications in week three.
This is the step where most smart home data workflows quietly fail. Thresholds set too tight produce daily false alarms; set too loose, they catch nothing. The ±15–20% band is forgiving enough to learn from.
Step 3 — Configure Automations and Alerts (Week 5–6)
Now you wire it up.
- Create a
templatesensor — call it something explicit likesensor.maintenance_alerts_active— that increments when correlated anomalies are detected. - Send notifications to a dedicated mobile channel, separate from your main notification stream. Alert fatigue kills predictive systems faster than bad sensors do.
- Choose digest cadence carefully. A daily 8 AM summary works better than real-time pings for non-urgent maintenance signals. Reserve real-time alerts for safety items only: leak detected, smoke, freeze risk.
The principle: maintenance signals are not urgent. They're trends. Treating them as urgent trains you to ignore them.
Step 4 — Schedule Monthly Reviews (Ongoing)
Block 30 minutes once a month. Not weekly. Not when the alerts fire. Monthly.
- Scroll through the month's anomaly log.
- Look for patterns, not single events. A one-day spike is noise. Three weeks of slow drift is a signal.
- Adjust thresholds quarterly to absorb seasonal change legitimately, not to silence real warnings.
This review is where IoT analytics stops being a buzzword and becomes a habit. Thirty minutes a month is a small investment that returns its cost the first time you book a service call in October instead of an emergency call in January.
Step 5 — Act, Document, Re-Baseline (As Needed)
When a signal persists for two or more weeks across correlated metrics, schedule service before it becomes urgent. Hand the technician a screenshot of the trend graph — many will diagnose faster from data than from descriptions, and most appreciate a customer who shows up with evidence.
After any repair or component change, re-baseline that device. The old normal is gone. Whatever the technician adjusted, refilled, replaced, or recalibrated has shifted the operating envelope, and your old thresholds will either alarm constantly or miss everything.
The whole workflow is iterative. Your first month will produce more false alarms than real ones — that's expected. By month three, your thresholds will be tuned and the false-alarm rate drops sharply.

A baseline you trust beats a sensor count you brag about. The home that knows its own normal predicts its own failures.
Five Mistakes That Wreck Predictive Maintenance — And How to Sidestep Them
Most predictive maintenance setups don't fail because the technology is bad. They fail because of repeatable, predictable mistakes in how the human side is configured.
Mistake 1 — Treating seasonal change as failure. Heating runtime increases in winter. That's physics, not a broken compressor. The fix is to always normalize against an external variable — outdoor temperature, occupancy, time of day — before flagging drift. Local systems make this trivial because you can query both sensors against the same timeline. A vendor app showing only the device in isolation cannot do this, which is why so many cloud-based "smart" alerts are useless in shoulder seasons.
Mistake 2 — Trusting one metric. A single power-draw spike could be a kettle, not a fridge failure. Single-metric alerts produce so many false positives that homeowners eventually mute them, which defeats the entire system. The fix is correlation: runtime drift plus power drift, plus sustained over days. Two signals moving together is signal. One signal moving alone is almost always noise.
Mistake 3 — Ignoring downstream cascades. A failing bathroom fan doesn't show up as a fan problem. It shows up as a humidity sensor recording 70%+ relative humidity for hours after showers, which then shows up as mold risk on bathroom walls weeks later. The fix is to build alert chains across rooms and device classes — humidity downstream of ventilation, temperature downstream of HVAC, energy draw downstream of everything. This kind of cross-domain IoT analytics is only practical when all your data lives on one local hub. Vendor silos make it impossible.
Mistake 4 — Reacting to breakdowns instead of trends. Most homeowners default to break/fix because they have no trend visibility. By the time the heater stops working, you're paying emergency rates for a problem that announced itself six weeks earlier. The fix is the monthly review from the previous section. Even 30 minutes once a month converts you from reactive to predictive — and the time investment is genuinely tiny relative to the savings on the first prevented emergency call.
Mistake 5 — Outsourcing interpretation to the device vendor. Cloud-app dashboards typically show "everything is fine" right up until they show "service required." Vendors have no commercial incentive to surface degradation early — service calls are revenue, replacements are revenue, and an alert that says "your device is degrading slowly" doesn't sell anything. The fix is owning the data. Local systems give the homeowner direct access to the raw smart home data, with no intermediary deciding what's visible.
Every device failure that shocks you is a failure of data visibility, not reliability. Local systems make the difference visible.
The thread running through all five mistakes is the same: predictive maintenance is a literacy problem more than a technology problem. Every Home Assistant deployment we configure includes a training step precisely so the client leaves equipped to read their own data, not just react to alerts. Smart device maintenance that depends on the homeowner understanding nothing tends to fail the homeowner first.

Realistic Scenarios — What Predictive Data Catches Before It Costs You
These are illustrative scenarios, not customer case studies. They describe the data patterns and diagnostic logic typical of each situation, not specific outcomes. The point is to show what predictive maintenance smart homes actually look like in operation — what the graphs say, what the data implies, and what a reasonable homeowner does next.
- The Slow Heat Pump. Setting: an air-source heat pump in a Warsaw single-family house, autumn shoulder season. Signal: runtime per degree of indoor temperature lift drifts up roughly 25% over six weeks. The outdoor temperature sensor shows weather isn't the cause — the system is simply working harder for the same delta. Logic: runtime drift uncorrelated with outdoor weather typically points at refrigerant charge loss or coil fouling, both of which compound rather than self-correct. Action: schedule a service visit in the shoulder season at standard rates, rather than during a January cold snap at emergency rates. The data wasn't ambiguous; it was just unread for six weeks before someone looked.
- The Whispering Water Heater. Setting: an electric water heater in an apartment, year-round usage. Signal: recovery time after a typical shower draw extends from roughly 25 minutes to about 38 minutes over two months. Standby consumption rises about 18% in the same window. Logic: both signals together — slower recovery and higher standby — point at element scaling or thermostat creep. Either one alone could be noise. Together, they're a diagnostic. Action: a drain-and-flush, an anode check, and possibly an element replacement, scheduled before the heater actually fails on a Sunday morning.
- The Drifting Fridge. Setting: a household refrigerator on an energy-monitoring smart plug, kitchen. Signal: compressor inrush peak grows from roughly 620W to about 830W over a month. Duty cycle increases from roughly 28% to about 41% in the same period. Logic: motor windings or condenser coil — either way, the device is working harder for the same cooling load. Action: clean the coils first (cheap, often sufficient). If duty cycle doesn't recover within two weeks, plan a replacement window before total failure forces it. A planned fridge replacement on a Saturday is a different experience from an emergency replacement with spoiled food.
- The Fading Mesh. Setting: a Zigbee sensor network across a small office, two years post-installation. Signal: three battery sensors show LQI dropping from 220 to under 100 over a month. Check-in intervals get irregular. Logic: mesh routing has degraded — almost always because a router-class device (a smart plug acting as a Zigbee repeater) is failing or has been moved, leaving battery sensors orphaned. Action: audit the Zigbee router devices, replace or relocate the weak link before sensors start reporting "unavailable" at the worst possible moment. This is smart device maintenance at its most preventable: nothing has actually failed yet, and a 20-minute mesh audit prevents weeks of intermittent sensor problems.
The pattern across all four scenarios is identical. The data was visible the entire time. The drift was measurable from the first week. What changed was that someone actually looked at the trend graph instead of the current state. Everything else followed from that single act.
Your First 90 Days — A Predictive Maintenance Action Plan
A predictive maintenance smart homes setup isn't a one-weekend project. It's a 90-day arc, after which the marginal effort drops to roughly 30 minutes a month. Here's the concrete plan.
Weeks 1–2: Inventory and Baseline
- List every smart device in the home with its category — HVAC, water, electrical, lighting, sensor.
- Verify Home Assistant's
recorderis retaining at least 30 days of history at full resolution. Adjustpurge_keep_daysif needed. - For your top 3–5 critical devices (heating, water heater, fridge, primary motion or contact sensors), screenshot the current 7-day history view as your visual baseline.
- Note the current season and outdoor temperature range. Your baseline is seasonal, not absolute, and that detail matters in three months when the weather shifts.
Weeks 3–4: Define and Encode Thresholds
- For each critical device, write down the metric, the baseline range, and the ±15–20% trigger value.
- Build at least two correlated-signal alerts per device. No single-metric alarms.
- Route alerts to a dedicated channel, separate from your main mobile notifications.
- Test each alert by triggering a benign condition — turning the fridge off briefly, simulating a temperature swing — to confirm the automation actually fires.
Weeks 5–8: Live Monitoring and First Review
- Let the system run. Resist the urge to retune in week 1 just because something alerted.
- At week 6, do your first 30-minute log review.
- Mark which alerts were noise and which were signal. Adjust thresholds to reduce noise — don't disable alerts.
- Add any device categories you missed in the original inventory.
Weeks 9–12: Iterate and Lock In
- Compare any actual repair, service event, or device replacement in the period against what your data predicted. The honest comparison is what calibrates the system.
- Re-baseline any device that was serviced, repaired, or replaced. The old normal is gone.
- Document your tuned thresholds in a Markdown note inside Home Assistant's
configfolder, so you don't lose the work to a future reinstall. - Set a recurring monthly calendar reminder for the 30-minute review. This is the keystone habit. Smart device maintenance without a recurring review collapses within a quarter.
The point of these 90 days isn't to build a perfect prediction system. It's to build the habit of looking. Most failures in a home aren't actually unpredictable — they're just unobserved. Once the workflow is in place, the marginal effort drops to roughly half an hour a month, and the payoff is the difference between a scheduled service call on a Tuesday afternoon and an emergency call at midnight in February. The whole point of investing in smart home data infrastructure is to make that difference visible — and then to act on what it shows you. If setting this up from scratch sounds like a weekend you'd rather not spend, that's exactly the kind of installation our five-step service handles end-to-end, including the training step that hands the data literacy to you, not just the dashboard.
